Distribution of wealth in a society of equals
In this blog I usually write posts related to information technology, but I stumble upon this post on NoiseFromAmerika (an italian blog about politics and economics) and I was surprised about how a concept backed by the common sense it’s so wrong when it’s analysed with scientific method.
I made a translation from italian to english of the post to be able to explain the concept and the analysis to anyone. The post is rather long and initially has references to political events in happened in Italy in 2011, but the core topic itself is politically and culturally agnostic.
I hope you’ll enjoy it.
TL;DR
From now on the post is the translation from italian to english of the original post La disuguaglianza della ricchezza in una societa di uguali by Sandro Brusco
In a society of equals the wealth is equally distributed, right? Wrong, a lot wrong. A didactic post who try to explain about the distribution of wealth.
Introduction
It’s about a couple of months I’m perplexed observing the “debate” developed around the wealth’s distribution in Italy. The main reason about my perplexity, and also the reason about the world “debate” is inside quotes, it because the discussion is proceeding by maintaning a tight and complete ignorance about both the main empiric evidences and elementary theoric observations. So I’d decided to write this post which it’s not pretending to expose somenthing new or particularly cunning but simply remember obvious facts which anyone bothered to mention.
The discussion, as far as I can say, started with a bizarre episode of late discovery of the data related to the family’s economic balance in a Banca d’Italia’s survey, in other words 10% of the families owns the 45% of the wealth. The episode, as it was commented out by this post, is bizarre because this figure was “re-discovered” months later at the same time during the publication of another Banca d’Italia’s survey specific on the country’s wealth. Anyway, excluding the bizarre or not bizarre way how the figure come out to the surface, since that moment that figure become at everyone’s attention. The proposals about a property tax to pay back the public debt sprouted out automatically. As example one proposal was exposed in this article of Peter Gomez on Il Fatto, which says:
We should thank the investigative offices of Banca d’Italia which today remembers us how the wealth of our country since years is still bad distributed
Using this statement as a starting point Gomez continues the article explaining how a property tax (and not anything else) can solve the problems of the country’s public debt. However there are two trivial questions which no one didn’t thought about, excluding the fact that Gomez is a very good journalist but it’s clear he doesn’t have economics skills. The first question is: if we want to evaluate the inequality in a society, is it a good idea to use the wealth as a parameter instead of other variables like the consumption or the income? And the second question is: if we use the wealth as a parameter, what how we can identify a normal inequality distribution?
Those questions, if true be told, are pretty difficult questions. The problems is almost all of the people involved in this discussion didn’t raise those questions. The majority expects the answer of the first question is “yes, it’s a good idea to use the wealth as a parameter”, and about the second question they consider the 45% of wealth owned by the 10% for the families a ration higher than the expected (the wealth is “bad distributed” Gomez said).
In this post I’ll introduce some examples which demonstrate why the answers to those questions are not easy to find. I want also to expose some extra theoric considerations about the wealth distribution and its relation with the welfare. I’ll say it again, ti’s nothing new and original, these should be well known concepts (but obviously they are not) to anyone who pretends to write articles on newspapers or blogs about these topics. I’ll not argue, if not only marginally, about the empiric evidence. I’ll do it in a next post.
First example: the society of perfect equals
Upper Rawlsand is a society where all citizens are perfect equals to each others. Every citizen lives exactly 80 years, in the first 20 years he doesn’t form any family and doesn’t earn any income (so we will not include the under-20 into the calculations of the wealth’s distribution). In the frist 40 years he works and after that in the remaining 20 years he gets a pension. At then he dies and he’s replaced with a brand new citizen which is a copy of the previous one (in economics this’s called “overlapping generations model”). The currency of this country is the rawlso, I’ll not tell the exchange rate with the euro because it’s irrelevant.
As I said, all the citizens are exactly equal. In particular, when they work the earn 100 rawlos per year; 30 ralwso are spent to pay taxes for pension’s funds and other expenses for young citizens, 70 rawlso are left in the citizen’s pocket. When a citizen reachs the pension age he’ll earn 40 ralwso which are not taxed.
Not only their ability to produce wealth is equal, but also their taste is equal. Every citizen tries to maintain a constant level of consumption (the higher as possible) for his whole life. Because every citizen has the same income in the whole life, even their consumption is exactly the same. No one leaves inheritance to the next generation because in Upper Rawsland the inheritance taxes are equal to the 100% and there’s no possibility to avoid them.
The society is going like that since a long time. Because is a static society the citizens in adulthood are equally divided between different age sets: 1/60th are 20-years old, 1/60th are 21-years old, and so on. There are no doubts about the equality of this society at all levels. We can prove it by watching at the consumptions. Any citizen consumes the same amount of wealth and the inequality, in any way you measure it, is zero. If we look at the income the only inequality is between wages and pensions. But the inequality between wages is exactly zero. And zero is the inequality between the income earned in the whole life time.
And what about the wealth? The wealth is evolving with the age. Remember all citizens has as objective to maintain his lifestyle unchanged through his whole life. When he will enter the pension age he’ll earn less than in the working age, so he’ll save monies during the 40 years of work (so accumulating wealth) and hel’ll spend all his saving and more (consuming is wealth) during the pension’s years. So how much wealth exactly he’ll save and how will it evolves? To answer it we need to speculate about the interests. Because we are using a simplified example we suppose the interests rate is 2% and constant in the time.
With this interests rate the citizen can support a constant consumption of 63.61 rawslo per year [only for nerds: this number is obtained by equalise the actual value of the constant’s cash flow times 60 years reduced by 2% with the actual value of the income of 70 rawslo times 40 years and 40 rawslo for the next 20 years reduced by 2% too]. When a citizen is working he’s saving 70 - 63.61 = 6.39 rawslo per year. At the end of the first year his wealth will be 6.39. At the end of the second year it’ll be 6.39 * 1.02 + 6.39, the wealth accumulated the first year increased by the interests rate plus the saving in the second year. And so one. The path of the wealth accumulation is shown in this graph:
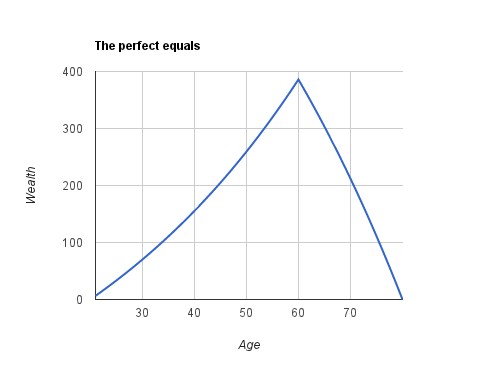
The wealth increases during the whole working age reaching its maximum at 60 years (the last year of employment). Since that point the wealth is “eaten” to allow the citizen to continue to consume 63.61 rawslo despite the 40 rawlso pension. In this society the most richest citizens are in a age around the pension age (just before and after) and the most poorest citizens are the ones which had just started to work, the one at the start of the process of wealth accumulation, and the ones at the end of their life, the one at the process of de-accumulation. If you put the data into a spreadsheet you will discover at the 60th year, the richest year, his wealth will be 386 rawlso.
Now lets try to calculate how much wealth is owned by the 10% richest citizens in this society of equals. For simplicity, suppose there is a citizen for every age between 21 to 80 years. The total wealth is 10,826 rawlso. The 10% richest citizens group is composed by the six age classes with the highest wealth, which are the citizens in the range between 57 to 62 years old (including the extremities). The wealth controlled by them is 2,186 rawlso, equal to 20.2% of the total wealth. That is, in this society of perfect equals the richest 10% controls more than the 20% of the wealth. The poorest 10% is composed by citizens in the range between 21 to 24 and 79 to 80 years. All together the poorest have a total of only 88 rawlso, which is less than 1% of the total wealth.
So in this society of perfect equals the richest 10% has a wealth ridiculously larger (20 times larger!) than the poorest 10%. We can all agree that this inequality in wealth’s distribution, in this society, should not raise any complains by anyone. In other words, using the wealth as a parameter in this society to measure the inequality is absolutely misleading.
Second example: the society of dynamic equals
In Lower Rawlsland the citizens are also equals but their wages are not constant during the whole life span. Their wages are lower when they are younger and increases during time with a rate of 1.5% per year. There are no other differences between Lower and Upper Rawlsland (a monetary union is in place; even in Lower Rawlsland the currency is the rawlso): same period of 40 years of work, same pension of 40 rawslo out of taxes.
The initial value of the wage (the wage of the first year of work) is chosen in the way I’ll generate the same amount of consumption flow of the previous example: it’s 53.65 rawslo. As the wages increase byt a 1.5% per year, when the citizen reach the pension age he’ll have a salary of 95.88 rawlso. This income stream can support a constant consumption flow of 63.61 rawlso per year. Again if we look at the inequality in the consumption, it’s simply doesn’t exists. So anyone consume, in every year of his life, the same amount of monies. Obviously the income will be not equal than the previous example, the older citizens will earn more than the youngest citizens. But remember the dynamic of the income is equal for all the citizens, so the actual amount if income per life cycle is the same for everyone.
And now talking about the wealth. This is a little more complicated than the previous example because at the start of the working career the consumption is greater than the income. To maintain constant the consumption flow is necessary to make debt when they are young, with a low salary, so to pay back the debt when they become older with an higher income. We suppose the citizen is paying, on top of his debt, the same interest rate (2%) he can obtain over his investments. We know that’s not a realistic hypothesis, but for the moment take it as valid; I’ll discuss later what’s happend when a citizen can’t make debts.
Here the graph which represent the evolution of the wealth in Lower Rawlsland:
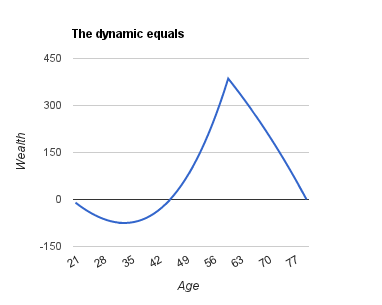
Every citizen make debts until his salary reach a level of 63.61 rawlso, which happens at 33-years old. Since that time the income is greater than the consumption so he’ll start to save monies. Until 45-years old he’ll pay back the debts, and since then he’ll start to accumulate wealth. The accumulation process last until the 60th year and it’s quick-paced because now the salary is much grater. When he’ll go into pension he’ll start to de-accumulate wealth to maintain the same consumption.
In this society a consistent part of the population (all citizens between 21 to 45-years old) have a negative wealth. The ones with a negative wealth are also the ones with loer wages. If we calculate the total net wealth of this society, that is subtracting the debt, we obtain 5242 rawlso. The richest 10% of Lower Rawlsland includes again the citizens around pension age, to be exact the citizens between 59 to 64 years, extremities included. These citizens controls a total wealth of 2,115 rawlsi, equals to 40.34% of the total net wealth. The poorest are the ones in the range between 31 to 36 years, the age when the citizen stops to accumulate debt and starts to pay it back. Around these age the debt is a little more than 70 rawslo.
In this society the concentration of the wealth is higher than the previous society. The 40.34% is not a figure far away than the 45% which raised so much complains by people. The wage’s inequality is higher too. But this is in fact a fair society where everyone consume the same amount f monies at every age and the sum of the income flow in the whole life cycle if the same for everyone. Even in this case using the wealth as a parameter is extremely misleading.
We saw how a rising salary profile its a good “trick” to increase the inequality of wealth in a society of equals. Another “trick” to increase the concentration of wealth if this set of examples is to suppose the population will increase instead of to remain static. If the population does increase there will be more younger than older citizens. The effect is just an “optical effect”. The society is still a society of equals.
Last example: the society of not equals
I don’t want to feed the sensation that the distribution of wealth can’t never be used as an useful index of inequality in a country. So considerate this next example, more informal than the previous ones but more explanatory.
In the Lacandonia country the citizens are clearly divided into two classes. The 99% of citizens are peasant. Everyone of them have a small plot of land which produce just enough to feed themselves, or nothing during the famine’s years (which reduce their average life-span). The income of every citizen is equal to the minimum consumption necessary to keep them alive, they don’t have any way to accumulate wealth, so it will be constant and equal to the value of their farmland. The other 1% of population is composed by landholders. These are heirs of a band of marauders which came from the sea centuries ago and conquered big plot of land ravaging the juts discovered country. The landholders are not interested of increasing the value of the land but only in enjoying the income. Even for them the value of the wealth is constant and equal to the value of all the owned land.
This is clearly an deep not equal society. If we were able to measure the inequality in this society the result would show a big disparity between the consumptions and the incomes. But suppose the consumption and the income cannot be easily measured, for example because most people consume their own production or because a presence of a trading system between citizens. In this case using the wealth’s distribution correlated to the amount of land owned produce a good guess of the level of inequality in that country.
The richest societies are not necessarily the ones with a better quality of life
It’s time to draw some conclusions from our examples. The first, which is unexpected, is it’s not true more wealth is equal to more welfare. Watch out I’m not saying that “the important things in the life are love, art and beauty” or some other Tremonti-Kennedy trivialty (in the sense of Robert Kennedy). I’m talking only about the leve of consumption that every member of a society can achieve.
Lets comparing Upper Rawlsland with Lower Rawlsland. In the first country, the one with a static incomes, the total wealth is 10,826 rawlso, in the second country, the one with an initial low incomes but increasing during the time, the total net wealth is less than a half, 5,242 rawlso. But both societies are absolutely identical, because the level consumption is the same. A rational person will chose to live indifferently in Upper or Lower Rawlsland.
It’s also possible to built examples of societies where the wealth is higher and the welfare is lower. Remember in Lower Rawlsland the citizens spend most of their youth to accumulate debts, and pay back the debts where they grow older and with higher wages. Now suppose it’s impossible to accumulate debts to support your consumption or the interests rate is much higher than the 2% which discourage people making debts. What we ca do n this situation? An optimal strategy can be in the first years the whole income is consumed and nothing is put aside. When the income reaches a determined level he will start to save monies. Since that point the consumption is constant and the mechanism is the usual one: accumulation of wealth until pension age and then de-accumulation.
In this society the wealth evolution is this:
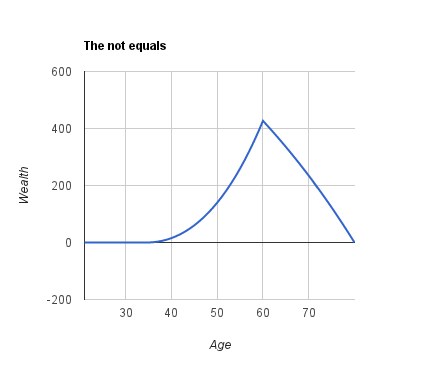
The important point is the total wealth, equal to 7,916 rawlso, is higher than the case where the younger citizens can make debt (5,242 rawlso). But in this society the life-style is worse. The citizens want to maintain a constant level of consumption but they cannot afford it because they cannot make debts. The higher level of wealth is generated by this form of financial constraint, which doesn’t produce any increment in the welfare.
Another important set of examples where the wealth is inversely correlated to the welfare can be obtained by introducing uncertainty. Lets make a very very simple example. An individual lives two life cycles and earn 100 in every period. He doesn’t need to accumulate, simply consume all the income of each life cycle. The wealth is equal to zero.
Now suppose that while earning 100 in the first life cycle is certain, there is uncertainty about the next life cycle. With a probability of 50% the income will be zero or the income will be 200. So, the income’s expectation in the second life cycle is always equal to 100, but now there is uncertainty. Under rather general circumstances our citizen will avoid to consume all the wealth in the first period and he’ll start to save monies in case of a zero income. This means the wealth is higher. But obviously anyone not used to afford risks will prefere to live in the first society, the one with null wealth, instead of living in the second one, the one with positive wealth.
Conclusion
The question related to the usefulness to look at the Italy wealth’s distribution in 2011 can be reduced to this question: is Italy more like Rawlsland or Lacandonia? That is, it’s a country where the wealth is mainly obtained by savings or by inheritance? We’ll discuss more deeply about it in the next post about empirical evidence, here I’ll raise just a simple observation.
In Rawlsland the wealth is proportional to the age of the citizen: it grows until the pension age and then decrease. In Lacandonia the wealth is static throughout the whole life cycle, because the wealth is inherited and no one save monies. Here are the result of the income’s investigation by Banca D’Italia about the median value of the net wealth by age classes (Tav. E2 pag. 73):
| Media value of net wealth | |
|---|---|
| up to 34 years | 37,000 |
| from 35 to 44 years | 131,172 |
| from 45 to 54 years | 175,595 |
| from 55 to 64 years | 211,200 |
| from 35 to 44 years | 131,172 |
| after 65 | 155,391 |
The wealth’s variance between ages is easy to spot: they start young and poor, they reach the maximum accumulation of wealth around the pension age, and the they de-accumulate. Obviously we must analyse this data keeping in mind all the available empirical evidence before reaching any conclusion, but this data shows that building wealth through savings is not an irrelevant part of the process.
Anyway my advice is when we are trying to evaluate how unfair as society is, the wealth is not the most useful parameter, anyway not for industrialised societies where the the income of the majority of the citizens is well above the poverty line. At least we should analyse the consumption and the income too.
Finally, when we can say the wealth si too concentrated and what the alarming ratio? The 45% owned by the 10% is an high ration or not? We saw in Lower Rawlsland, a society of perfect equals, the top 10% of citizens controls the 40% of wealth, so the answer to this question is not trivial. We will talk again about that with empirical data.